A grant-funded computer vision-based system to count fish under various conditions entering Massachusetts Fisheries.
MIT Fishery
I am currently working on an ongoing project to detect and count fish in Massachusetts Fisheries. This project is funded by a grant from the federal government. I started working on this project in 2022, and I am working individually with a research professor and MIT PhD students. I am responsible taking the initial research project and making it operational: 1) Making model performant enough to count fish 2) Working with research grant funding to set up appropriate infrastructure and 3) deploying the infrastructure.
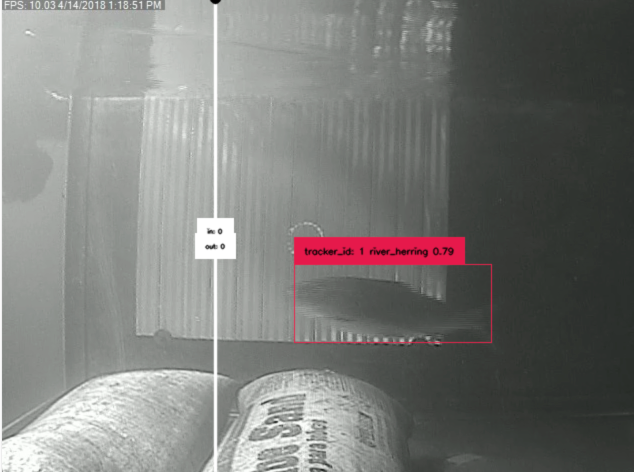
Table of Contents
- MIT Fishery
- Table of Contents
- QA Bot: Ask questions about the repository:
- Public Demo of dashboard
- Overview
- Object Detection:
- Performance
- Data Preparation
- Video Considerations
- Due to the extreme varition in camera quality and image quality the following types of image augmentation have become extremely usefuly in the quality of model:
- Example of the need for more data when counting AND tracking
- Breakdown of different challenges with data quality:
- Annotation and General Approach Notes for Object Counting in Video
- What does a label “balanced” look like in object detection?
- Dataset Selection and Training:
- Bayesian Optimization with wandb.sweeps:
- Tracking
QA Bot: Ask questions about the repository:

Public Demo of dashboard
Overview
Fisheries populations have a large impact on the U.S. economy. Each year the U.S. fishing industry contributes 90 billion dollars and 1.5 million jobs to the U.S. economy. Each species may serve as a predator or prey for another. In this regard, fisheries populations are interconnected and dependent. While humans may depend on these populations as a source of sustenance (food, goods, etc.), humans can also negatively impact population growth. Barriers to migration, pollution, overfishing, and other forms of human-interference may impact spawning patterns of fisheries species. In 2014, 17% of U.S. fisheries were classified as overfished. Therefore, it is necessary to monitor these fisheries populations to determine when policy must be changed in efforts to maintain healthy oceans.
Many groups, including NOAA Fisheries, state agencies, as well as regional fisheries councils and local municipalities, deploy camera and video equipment to monitor fisheries populations. Large amounts of video and photographic data are gathered at timed intervals. However, not all photos contain aquatic life. Currently, employees at these agencies among others are responsible for manually annotating the gathered videos and photos; this means they identify and count the relevant aquatic specimens in the data. Not only is this an inefficient use of time and resources, but also it can lead to inaccurate results due to human error. NOAA Fisheries Management can make a significant improvement in time and resource use through automation of the annotation process.
Throughout the project, I have made significant progress in addressing these challenges and have achieved promising results. Here’s an overview of the key aspects and advancements made:
Object Detection:
The initial challenge involved designing an accurate object detection algorithm specifically tailored for fish tracking. It required careful consideration of model architecture, hyperparameters, and dataset selection. Through iterative experimentation and fine-tuning.
- Original YOLO paper: (You Only Look Once: Unified, Real-Time Object Detection)[https://arxiv.org/abs/1506.02640]
Performance
The primary metric used to assess performance in training the object detection is map50-95 (mean average precision at IoU (Intersection over Union) thresholds of 0.5 to 0.95) which I baselined the project with at 0.31 and now at 0.72 has become sufficent for tracking in videos to receive a 0.28 MAPE (Mean Absolute Percentage Error). This doesn’t reflect the full picture of how well the algorithm performs in tracking an object from one point to another. There is more discussion on this later.
Performance Comparison for Different Years
Overview
This section provides a comparison of the algorithm’s performance across different years (2016, 2017, and 2018) at one specific site. The performance metrics considered include videos_missed, mape, total_percent_error, misscounts, total_herring, rmse, mae, and f1.
Metrics: Detecting and Tracking
To track and count fish objects effectively, there is obviously a need to detect/classify the fish which affects the performance tracking the fish from frame to frame.
Detecting
\[\text{MAPE} = \frac{1}{n} \sum_{i=1}^{n} \left| \frac{\text{True Counts}_i - \text{Predicted Counts}_i}{\text{True Counts}_i} \right| \times 100\]This is a good overall metric that generally captures how well, for a series of video segments, your algorithm counts the objects. For my use-case, because the video is initially starts recording for movement (can be triggered by seaweed as well as fish), each video capturing the fish is ~30sec. For MAPE, this means that if only 1 fish was in the video and it was not counted which will be penalized more heavily than a video with 2 fish where only 1 was counted. This can be important since a lot of fish will swim in parallel which can add to the difficulty in detection.
Performance Metrics
Here’s a breakdown of the performance metrics for each year:
| Year | Videos Missed | MAPE | Total Percent Error | Misscounts | Total Herring | RMSE | MAE | F1 |
|---|---|---|---|---|---|---|---|---|
| 2016 | 4 | 0.196667 | 0.333333 | 7 | 21 | 1.9 | 0.7 | 0.333333 |
| 2017 | 3 | 0.09375 | 0.12 | 3 | 25 | 0.1875 | 0.1875 | 0.856459 |
| 2018 | 11 | 0.166667 | 0.12 | 9 | 75 | 0.543478 | 0.326087 | 0.611905 |
Discussion
The performance variance over the years can be attributed to several factors, including variations in video quality, lighting conditions, and the presence of other objects that can reduce confidence in herring frame to frame. These factors pose challenges for accurate fish detection and tracking, leading to differences in the algorithm’s effectiveness across different years. The primary factor in better performance seems to be the light quality that helps define the fish. However, despite these challenges, the algorithm has demonstrated consistent improvement in performance over time, as evidenced by the evolving metrics.
Data Preparation
Video Considerations
The ideal sample rate depends on how fast objects move. For slower videos, a lower rate might suffice. But to capture every detail of speedy objects, you’ll need to annotate more frames, ensuring you have enough data to calculate their velocity accurately.
Due to the extreme varition in camera quality and image quality the following types of image augmentation have become extremely usefuly in the quality of model:
Example Image Augmentation
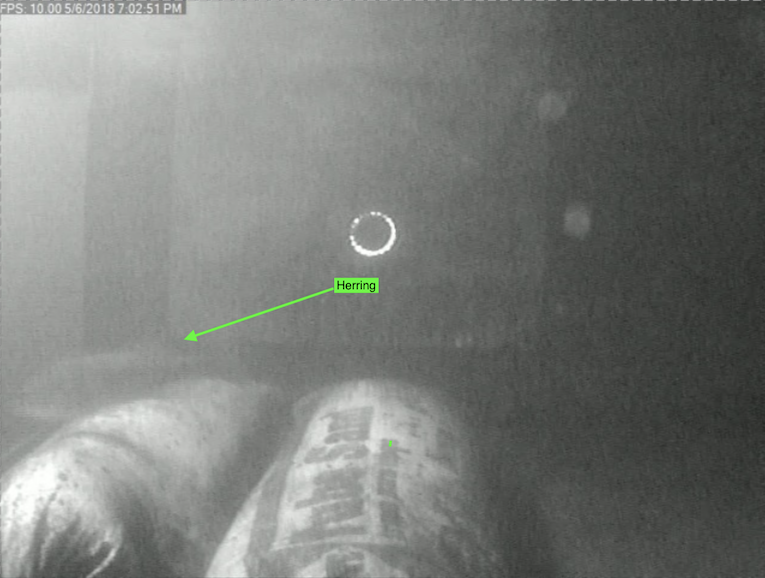
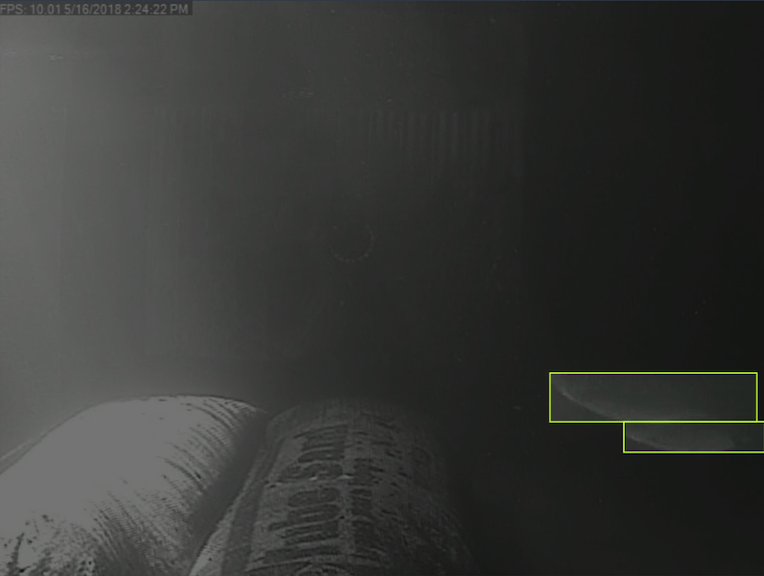
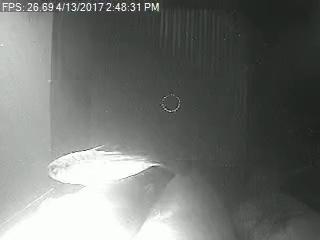
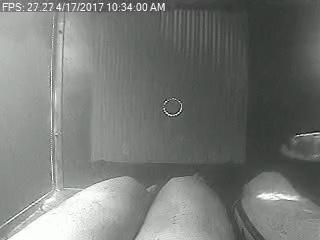
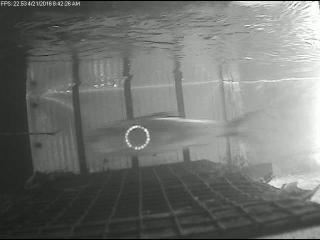
Example of Challenging Atmospheric Conditions for ID-ing of Fish for Purposes of Tracking
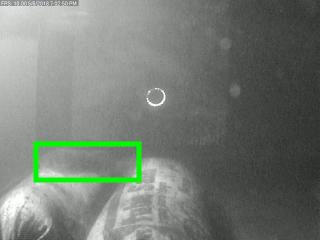
Example of the need for more data when counting AND tracking
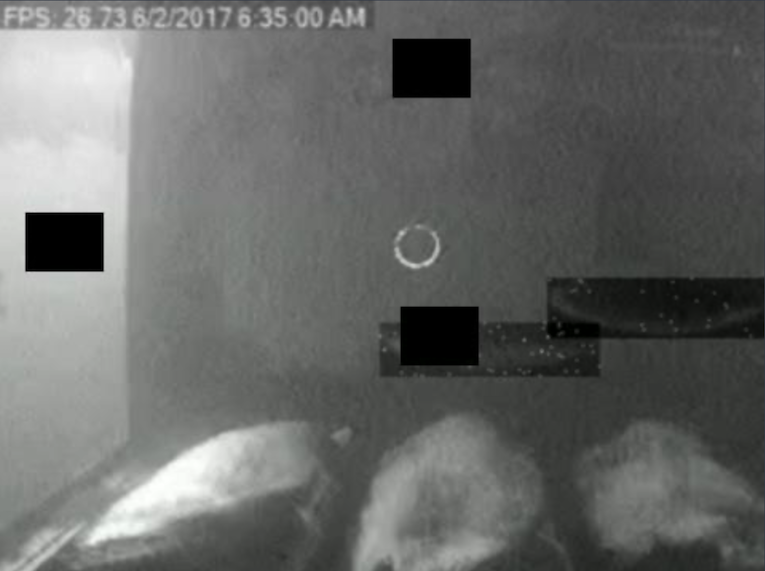
Breakdown of different challenges with data quality:
1) Illumination Challenge: In object tracking, illumination challenges arise when the lighting conditions change dramatically across frames or in different parts of the video. This variation in brightness, shadows, and highlights can affect the appearance of the object, making it difficult for the tracker to maintain accurate identification.
2) Occlusion Challenge: Occlusion occurs when an object being tracked is partially or completely obscured by other objects, elements, or even itself. Occlusions can disrupt the object’s visibility, leading to potential misidentifications or temporary loss of tracking. This is of particulary problem for this situation since we want to pick up the fish as soon as possible to establish a unique tracking id.
3) Deformation Challenge: Deformation challenges refer to situations where the object of interest undergoes significant shape changes over time. This could occur due to the object’s inherent flexibility or interactions with other objects. Tracking such deformable objects requires handling non-rigid transformations effectively.
4) Noise Corruption/Blurring Challenge: Noise in the image data can be caused by various factors, such as sensor limitations, compression artifacts, or environmental conditions. Noise corruption poses a challenge to object tracking by introducing unwanted fluctuations and reducing the clarity of the object’s features.
5) Out of Plane Rotation Challenge: Out of plane rotation occurs when the object is viewed from different angles, leading to changes in its appearance and perspective across frames. Accurately tracking objects with out of plane rotations requires handling geometric transformations.
6) Motion Blurring Challenge: Motion blur is caused by the relative motion between the camera and the object during exposure, resulting in smearing of the object’s appearance. Tracking objects affected by motion blur requires robustness to handle the loss of fine details and sharpness in the image.
Annotation and General Approach Notes for Object Counting in Video
- When splitting images between train/val/test by complete journey of object across screen. I.e. split all of the images of a fish traveling across screen into train then a seperate fish traveling across screen into val.
- Set the confidence of your YOLO inference at the confidence that maximizes your F1 score. E.g. Max 98% @ Confidence = 0.32. Although maximizing for recall is good, the F1 score is more directly correlated with tracking a fish across the screen.
- Try and hit ~1000 instances of an object class that is to be tracked
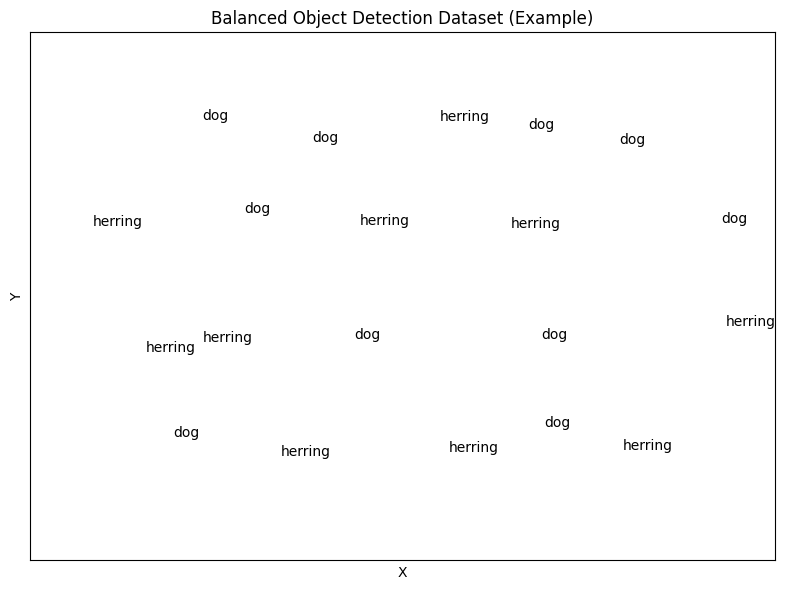
What does a label “balanced” look like in object detection?
In this context, “balanced” doesn’t refer to the visual appearance of a label itself. Instead, it describes the distribution of labels within a dataset used to train an object detection model. A balanced dataset ensures that all object categories have roughly the same number of examples. This is crucial for optimal model performance, as an unbalanced dataset can lead the model to prioritize the frequently occurring categories and struggle to detect less frequent ones. Ideally, a “balanced” label distribution would have a similar number of labels for each object class, creating a level playing field for the model to learn from all categories effectively.
Dataset Selection and Training:
“garbage in, garbage out.” So, I spent a good amount of time curating a diverse dataset with annotated fish images and videos. Lighting conditions, backgrounds, and different fish species etc. By training the model on a curated dataset, I witnessed significant improvements in detection performance.
Holdout Set for Validation:
To make sure our counting game is on point, I set aside a holdout set of videos with ground truth fish counts. It’s like having a benchmark to compare against. I tested the algorithm’s count predictions against the ground truth, giving us valuable insights into its accuracy and effectiveness. No fishy business here!
Bayesian Optimization with wandb.sweeps:
I gained enough confidence to narrow down my parameter search space. With the help of Wandb.Sweeps’ Bayesian optimization capabilities, I let the algorithm do its magic overnight. It efficiently explored the parameter space and brought me some impressive results. It’s like having a super-smart assistant working while I catch some zzz’s.
Tracking
The “botsort” algorithm leverages motion patterns to estimate object displacement, matches appearances to maintain consistency across frames, and predicts future positions based on historical trajectory data. This comprehensive approach has significantly improved tracking accuracy and facilitated reliable fish counting.
It was selected because it had the best MOTA (Multiple Object Tracking Accuracy) that considers identity switches, false positives, and false negatives.
\[\text{MOTA} = 1 - \frac{\frac{1}{n} \sum_{i=1}^{n}(\text{False Positives}_i + \text{False Negatives}_i + \text{Identity Switches}_i)}{\frac{1}{n} \sum_{i=1}^{n}(\text{Total Number of Ground Truth Objects}_i)}\]